



Dr. Vikas Bhardwaj
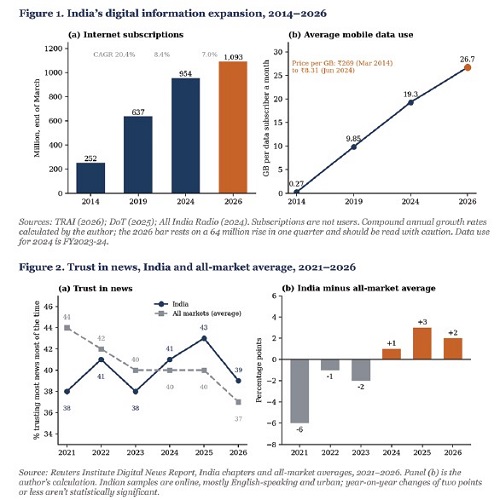
Between March 2014 and March 2026, India’s internet subscriptions rose from 251.6 million to 1,092.8 million, and the price of a gigabyte fell from ₹269 to ₹8.31 (TRAI 2026; All India Radio 2024). Over the same years its Reporters Without Borders rank slipped from 140th to 157th (RSF 2026). Critics treat the second fact as the whole story. It means little until the comparison runs in three directions: India against its own earlier governments, India against other democracies, and the indices against what they claim to measure. Run that way, the evidence favours the present government on access, on trust and on the record of institutional checks, and leaves its critics leaning on instruments that can’t see two of those three.
Access: a supply shock with a price elasticity
Subscriptions grew at 20.4 per cent a year to 2019, 8.4 per cent to 2024 and 7.0 per cent since, the profile of a market approaching saturation at 76.6 subscriptions per hundred people (Figure 1). Monthly use per data subscriber went from 0.27 GB to 26.7 GB (DoT 2025; TRAI 2026). Set against price, the numbers read like a demand curve. A gigabyte became about thirty-two times cheaper while average use rose roughly seventy-one times by FY2023-24, so the implied monthly data bill moved from about ₹73 to about ₹160 (author’s calculation, indicative only because the price and usage series date differently) . Households paid about twice as much for seventy times the information.
For a news market that is a collapse in the marginal cost of distribution, and it lowered the entry barrier for every regional publisher and independent creator. The Department of Economic Affairs credits Reliance Jio’s 2016 entry for starting the slide (Tele.Net 2023), and a private firm’s pricing isn’t a government achievement . What government controls is the licensing, spectrum and public-infrastructure environment in which such a move can happen at scale.
Trust: the relative position
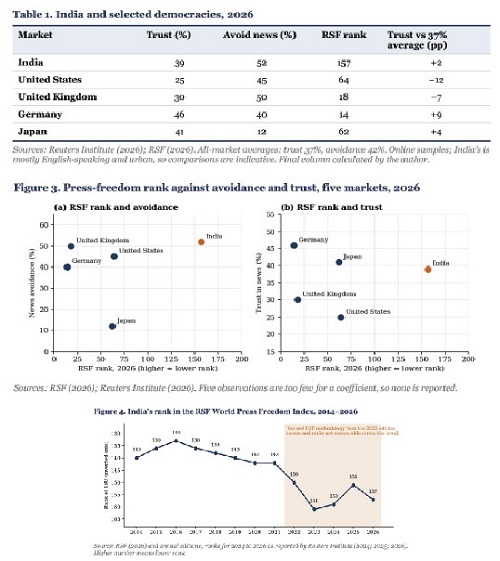
Trust is where the comparison turns. Indian trust read 38 per cent in 2021 and 39 in 2026, peaking at 43 in 2025, while the all-market average slid from 44 to 37 (Reuters Institute 2021; 2026). India moved from six points below the average to two above it, an eight-point swing in five years (Figure 2). A captured system should show the reverse, with trust draining as independent reporting is crowded out. The sample is mostly English-speaking, urban and online, so the level isn’t a national estimate, but the frame was equally narrow in 2021 and the direction of change survives. Six annual readings correlated with subscription counts give r = 0.18 (p = 0.74), which can’t be told from zero, and I wouldn’t claim access causes trust.
Five democracies compared
Avoidance is the weak point and deserves a straight reading. At 52 per cent India has the highest rate of the five markets, and Japan’s 12 per cent makes the gap look dramatic (Table 1). The United Kingdom, though, ranks 18th in RSF’s index and records 50 per cent, and the United States, 64th, records 45. Toff and Kalogeropoulos (2020) found that higher press freedom predicts lower avoidance across 35 countries, yet the five-market spread in Figure 3 shows the pattern is loose. Trust tells a different story: India sits above the United States and United Kingdom despite a rank 93 and 139 places lower. Fatigue with a high-volume news cycle looks like a general feature of platform-era markets, though the data don’t test that.
What the rankings measure
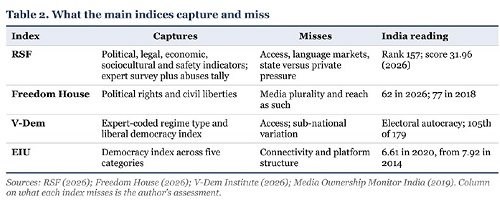
The rankings measure real things, though not what the access and trust data measure. RSF scores five indicators, and its tally of abuses supplies only a third of the safety indicator (RSF 2026). It changed method in 2022, so the fall from 142nd in 2021 to 150th in 2022 and 161st in 2023 can’t be read as one continuous series (Figure 4). Freedom House (62 in 2026) and V-Dem (electoral autocracy) agree on direction and disagree on regime type. None measures access, none scores India’s thirteen or more print language markets separately, and none separates state pressure from private ownership (Media Ownership Monitor India 2019; Table 2). A composite that can’t register a 334 per cent rise in connectivity captures a legal and political climate, which is a different object from the one this argument concerns. One thing the indices can’t code is observable all the same. In 2024 the Supreme Court struck down the electoral-bonds scheme and put the government’s fact-check unit on hold (Reuters Institute 2024).
Instruments of control, by government
Compare the instruments used against the press across eras and the pattern is clearer than the scores suggest (Table 3). Congress governments used blunt legal ones. The First Amendment of 1951 added restrictions to Article 19(1)(a) within a year of the first general election . The Emergency imposed pre-censorship from June 1975 to March 1977, about twenty-one months. The 1988 Defamation Bill was withdrawn after press protests. Section 66A of the IT Act, a UPA-era provision struck down by the Supreme Court in 2015, produced the 2012 Palghar arrests under a Congress-NCP state government. These are prior-restraint instruments, the category RSF’s legal indicator exists to capture, and they rarely enter the comparison.
The AAP’s Delhi government used the economic instrument. Delhi’s information directorate issued recovery notices of ₹97 crore in 2016 and about ₹164 crore in 2022 over advertisements it judged to breach Supreme Court guidelines. State advertising is the lever the economics predicts: where revenue depends on a few large buyers, editorial independence becomes a bargaining position that can be bought or withdrawn (Media Ownership Monitor India 2019). An anti-establishment party spending public money on its own visibility shows that capture needs no statute.
The present government’s record on the same instruments differs on institutional grounds. There’s no pre-censorship regime and no Emergency equivalent, and courts have reviewed both statute and executive action. The measurable question is whether review is available and used, and on that question the record favours the government.
The hypothesis and the verdict
H1 held that expanded choice hasn’t bought trust or perceived fairness. On trust the relative evidence runs against it: India held between 38 and 43 per cent while the average fell seven points. On perceived fairness as scored by expert indices H1 survives, though those indices can’t register access or plurality. H0 can’t be rejected, since six observations and a mismatched sample frame can’t carry causal inference. Concentration is real, with four Hindi dailies holding 76.5 per cent of Hindi readership and three operators carrying 95.3 per cent of subscriptions, and it tracks consolidation in Washington and London (Media Ownership Monitor India 2019; Reuters Institute 2026). Thirteen of fifty-eight sampled outlets were politically affiliated, forty-five weren’t, and in 2024 five critical digital outlets jointly streamed ad-free election results on YouTube, where 58 per cent of respondents now get news weekly (Reuters Institute 2024; 2026).
India’s media is neither uniformly free nor uniformly controlled. Set against the Emergency-era state, the UPA’s speech statutes and Delhi’s advertising spend, and against the trust record of the United States and United Kingdom, the BJP-led government presides over the widest access, the steadiest trust and a functioning judiciary. The democratic question has shifted from who may speak to who is heard, who is believed and who owns the switches in between, and on that terrain India’s record is stronger than its ranking suggests.
(The content of this article reflects the views of writer and contributor, not necessarily those of the publisher and editor. All disputes are subject to the exclusive jurisdiction of competent courts and forums in Delhi/New Delhi only)



















Leave Your Comment